Patterns of Climate Change Impacts on Precipitation Data
Sep 2021 - Dec 2021, Stanford University
Study Focus
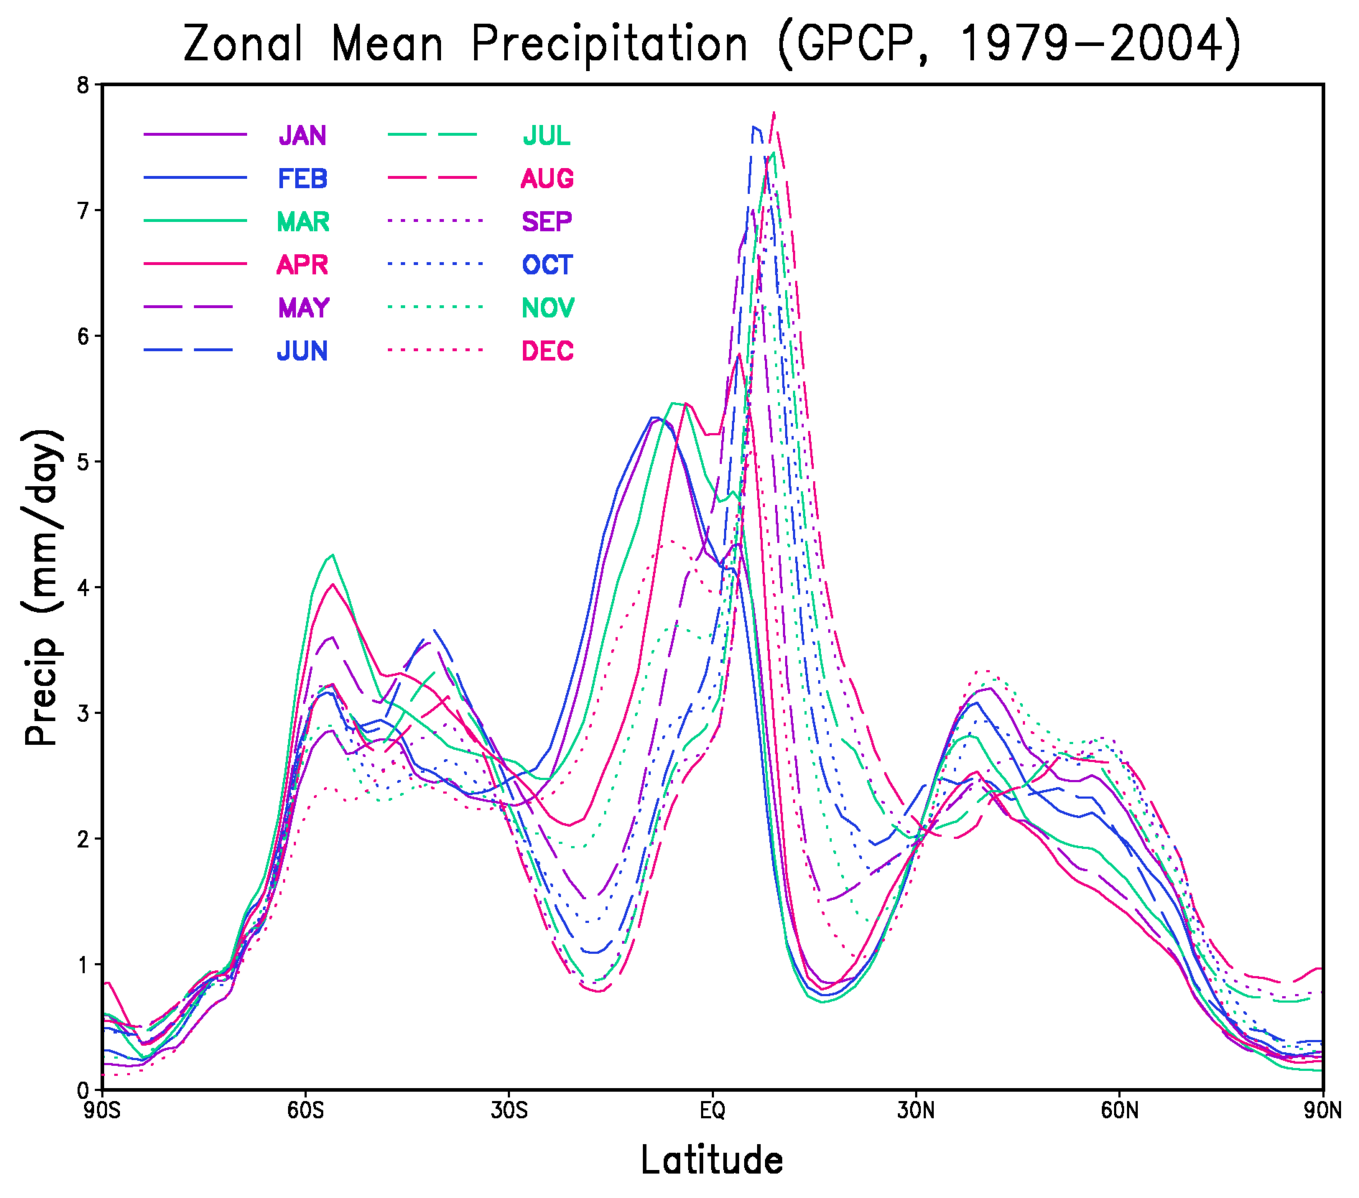
Precipitation patterns and their impact are crucial for water resource and risk management. Its seasonality and cyclical features often characterize precipitation patterns. However, due to climate change, non-cyclic anomalies are becoming more apparent, and it's essential to unmask the impact of climate change. This study focused on answering whether there was a significant change point observed around the 1960s, the period when climate change is assumed to have happened. The precipitation data are extracted from the NASA website using the CRU TS 2.0 dataset, composed of monthly grids of observed climate, with each grid covering the global surface at 0.5° by 0.5°. Locations were chosen and categorized according to their zonal mean precipitation. Image Source

Selected Locations
Wet locations: Quito, Ecuador; Kuala Lumpur, Malaysia; Mogadishu, Somalia (around latitude 0)
Moderate locations: New York, USA; Muscat, Omen; Hanoi, Vietnam; Cape Town, South Africa; Cancun, Mexico; Canberra, Australia (around latitude 0 - 65N)
Dry locations: Anchorage, USA; Reykjavik, Iceland; Stockholm, Sweden (around latitude 65N)
Method
This project focused on trend detection and change point detection. A two-sided Mann-Kendall(MK) test was utilized for trend detection, while Kolmogorov-Smirnov(KS) test and Cramer von Mises(CvM) test were operated for change point detection. I concluded that there is a trend or a change point when the p-value is under 0.025 with a 90% confidence interval. This project assumes that there might be a climate change impact when change points or trend changes exist around the 1960s.
Result and Discussion
The figures illustrate the p-values from the CvM tests of wet, dry, and moderate locations.
For wet locations, with both KS and CvM tests, Kuala Lumpur, Malaysia, and Mogadishu, Somalia, reported significant change points in 1966 and 1953, respectively.
However, Kuala Lumpur presented its change period for a short period; on the other hand, Mogadishu presented the continuous change point after 1953.
By operating further analysis with the MK test, Mogadishu presented a strong trend from 1953 to 2020, while no significant trend existed from 1900 to 1953.
The result of the MK test indicates that the trend started to happen after 1953.

Significant change points were not found for dry locations from 1900 to 2020. For Stockholm and Anchorage, none of the periods reached the p-value under 0.25. On the other hand, Reykjavik, Iceland, got under 0.25 from the 1910s to the 2010s. However, the MK test showed a meaningful trend throughout the period. Therefore, Reykjavik was considered to be not adequate to conclude whether there was an impact of climate change on Reykjavik. Therefore, none of the selected dry locations indicated a valid impact of climate change.

For moderate locations, significant change points were indicated for 3 out of six locations, New York, USA, Hanoi, Vietnam, and Canberra, Australia. New York showed consistent change points after 1961, and Hanoi had a one-time change point around 1952. Since New York showed consistent change points, the MK test was conducted to check whether there was any trend. As a result, the trend existed from 1961 to 2020, while no trend existed from 1991 to 1961. Therefore, the trend started to happen in 1961. The most intriguing location among moderate locations was Canberra, Australia. It had continuous change points until 1958. However, it disappeared after 1958. The MK test indicated that there was a trend from 1991 to 1958, and it vanished after 1958. The cause of the trend before 1958 is not could not be identified. For Muscat, Omen, it did not show any trend and change point. Also, Cape Town, South Africa, and Cancun, Mexico, showed change points in diverse time periods and trends throughout the whole period. Therefore, these locations were considered not adequate for analysis.


Conclusion and New Hydrological Insights
Dry locations seemed to be less impacted by climate change. Except for locations considered inadequate, two out of two dry locations had no significant climate change impact. On the other hand, two out of two adequate wet locations showed signs of climate change, which indicates that wet locations are potentially more impacted by climate change. Lastly, Three out of four adequate moderate locations had a possible impact from climate change for moderate locations.
Precipitation is one of the most important origins of water resources. Therefore, it is crucial to reveal the influence of climate change on precipitation. This project would be useful for decision-makers and water users to plan short-term and long-term water usage.